NOV11 Valgo Progress Update
10-11-2025 14:00:00
Valgo: Building a High-Performance Trading Terminal in Python
Current State: November 2025
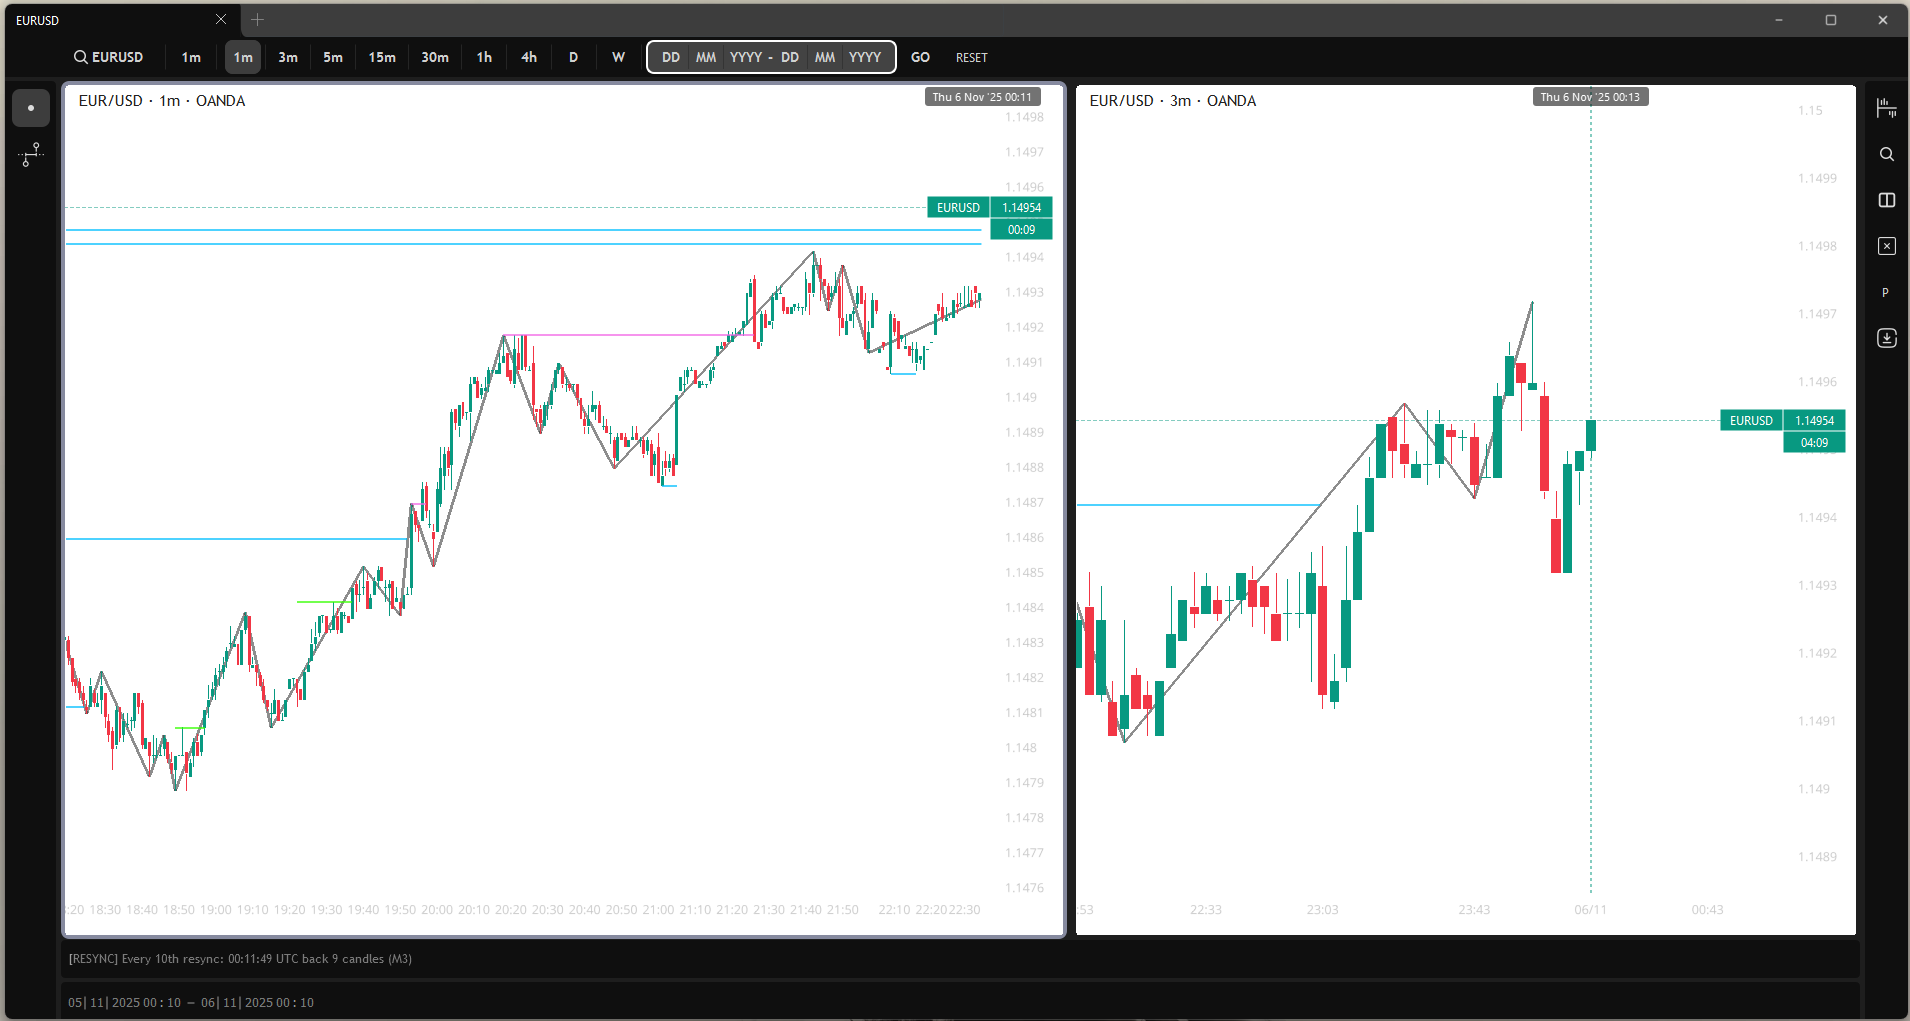
I've been building Valgo, a real-time forex trading terminal designed for technical analysis and market structure visualisation. The application pulls data from OANDA's API and renders candlestick charts with OpenGL-accelerated overlays. After around 500 Python files and several architectural refactors, the system now handles real-time streaming, GPU-accelerated analysis, and complex UI interactions without visible lag.
This post covers the architecture, key technical decisions, recent feature additions, and what I've learned about building responsive desktop applications in Python.
Architecture: Clean, But Pragmatic
The codebase follows Clean Architecture with Domain-Driven Design patterns. I chose this structure early because the domain logic (charting, analysis, viewport culling) needed isolation from UI frameworks and data sources.
The core layer (149 files) contains domain models, business logic, services, and application commands/queries. Zero dependencies on PySide6 or VisPy. The charting engine lives here: camera, viewport, zoom bounds, interaction rules. Adapters (68 files) bridge core logic to external systems. OANDA client, SQLite repositories, VisPy visual adapters, Qt event handlers, logging infrastructure. The GUI layer (105 files) contains PySide6 widgets, controllers (MVVM-style), chart components, and visual overlays. This layer orchestrates user interactions and delegates to core services. Shared modules provide dependency injection container, event bus, configuration schemas, utilities.
I use CQRS to separate reads from writes. Commands (e.g., ChangeTimeframeCommand, RunAnalysisCommand)
mutate state, queries (e.g., GetVisibleDataQuery) return data. Mediators route both to handlers. The event-driven
architecture uses an EventBus with 254 usages across 58 files. Events like ViewportChanged,
DataLoaded, AnalysisCompleted decouple chart rendering from data fetching. The repository pattern
abstracts persistence. All data access goes through repository interfaces. SQLite implementations (market data, user
preferences, analysis cache) live in adapters. Switching to Parquet for historical data required one new adapter, no core
changes. Dependency injection via ServiceContainer wires up roughly 80 services, repositories, and controllers at startup.
Type-safe resolution with protocol interfaces.
Early on, I tried a simpler structure: one module for UI, one for data, some utility files. Rapid interval switching caused crashes because Qt threads, VisPy rendering, and OANDA requests tangled together. Refactoring to Clean Architecture forced me to define boundaries: no direct Qt imports in domain logic, no business rules in adapters. This paid off when adding GPU acceleration (CuPy integration required zero changes to GUI code) and date range mode (new command handlers, same core models).
Tech Stack: Why These Choices
PySide6 (Qt6) provides a mature widget library with excellent stylesheet support. Custom title bar, drag-and-drop chart
reordering, animated menus all work straightforwardly with Qt's signal/slot system. Drawback: some CSS issues. Border-radius
leaves corner gaps, stylesheets override palettes unpredictably. I documented these in .agent/docs/known_issues/.
VisPy (OpenGL) renders candlesticks, lines, and overlays via GPU. I batch line segments into single vertex buffers (roughly 5ms
for 10,000 candles). Shader files (12 GLSL vertex/fragment shaders) handle wicks, bodies, dashed lines. VisPy's
SceneCanvas integrates cleanly with Qt via QVBoxLayout.
SQLite (WAL mode) stores all user data: chart preferences, favourite intervals, analysis cache. WAL mode allows concurrent reads during writes. Around 7 repository implementations. Simple, fast, zero-config persistence. CuPy (CUDA) provides optional GPU acceleration for market structure analysis (BOS detection, sweep calculations). Nvidia RTX GPUs reduce pivot detection from roughly 150ms to roughly 30ms on 50,000 candles. Falls back to NumPy if unavailable. 9 files reference CuPy, all wrapped in try/except with graceful degradation.
Why not Electron? Python's scientific stack (NumPy, CuPy) and Qt's native performance made Python + PySide6 faster to prototype and easier to optimise than bundling a Node.js app. Why not web rendering (Three.js)? VisPy's direct OpenGL control gave me batched line segments and custom shaders without browser overhead. WebGL would add latency for real-time streaming. Why not Postgres? SQLite handles datasets under 10GB fine. WAL mode eliminates lock contention. If I add multi-user features later, I'll swap repositories. Core logic stays untouched.
Recent Features: What's New
1. Event Coalescing
Rapid viewport panning fired 60+ ViewportChanged events per second. Axis tick recalculation (finding nice round
numbers for Y-axis labels) took roughly 5ms per event. Result: 300ms lag, choppy panning. I added coalescing to EventBus. Events
with coalesceable=True merge during a 16ms window (one frame). Only the latest ViewportChanged fires
its handler.
Implementation touched 6 files (event bus adapter, registration, coordinators). Each event now declares
is_coalesceable: bool. The bus maintains a dict of pending coalesced events, flushed on QTimer. Panning latency
dropped from roughly 300ms to imperceptible. Side benefit: lower CPU usage during zoom interactions.
2. Date Range Mode
I added the ability to load historical data by picking start/end dates instead of "last N candles." Custom gradient date picker widget with history breadcrumbs. OANDA's free tier limits responses to 5,000 candles. For backtesting or reviewing old market structure, I needed arbitrary date ranges. Live mode (streaming latest data) and date range mode now coexist. Switching clears the chart, fetches historical data, and disables streaming.
New command: LoadDataByDateRangeCommand (replaces live mode's LoadHistoricalDataCommand). GUI widget:
GradientDateRangeInput (7 files: field manager, animation manager, selection manager, renderer). Gradient
background shifts based on cursor position (visual polish, roughly 100 lines). Repository layer: ParquetReader now
handles date-bounded queries. OANDA adapter maps date ranges to candle counts. Complexity: roughly 20 files modified. Most
changes in adapters/GUI, core charting logic unchanged.
3. GPU-Accelerated Analysis
Market structure detection (BOS, ChoCh, sweeps) runs on GPU via CuPy. Technical analysis algorithms scan price data for pivot points (local highs/lows), then detect "breaks of structure" (price crossing prior pivots). On 50,000 candles, pure Python took roughly 150ms. Unacceptable for real-time overlays.
Pivot detection: CuPy kernels find local extrema via convolution-style rolling windows. Sweep detection: vectorised comparisons
(e.g., "current high > prior swing high"). GPU parallelises across all candles. If CuPy unavailable (no Nvidia GPU, wrong
CUDA version), fall back to NumPy. Same API via protocol classes. Performance: roughly 30 to 40ms on RTX GPUs (estimate, varies
with candle count). Roughly 5x speedup vs. NumPy. Measured via @timing decorator and GPU profiler service (17
logging calls). Files affected: 9 files import CuPy, roughly 70 files reference "sweep," "BOS," or "market structure." Core
analysis services abstract GPU/CPU choice.
4. Axis Label Hiding During Interaction
Axis labels (price ticks, time labels) hide when panning or resizing splitters between charts. Reduces visual noise, improves perceived responsiveness. Users reported "flickering" Y-axis labels during fast panning. Root cause: labels regenerated every frame but took roughly 2ms to render. Hiding during interaction delays rendering until interaction ends (debounced via 250ms QTimer).
I added InteractionRules.should_hide_axes_during_interaction() method. Checks both panning and splitter resizing
flags. ChartAreaManager tracks splitter state with QTimer debouncing.
FrameTickInteractionController queries interaction rules before rendering. Result: no label flicker. Labels
reappear smoothly after interaction stops.
Performance Characteristics
Rendering: 10,000 candlesticks at 160fps (measured via FPS overlay). Batched OpenGL draw calls, one for wicks, one for bodies. Viewport culling service filters visible candles before sending to GPU. Data loading: OANDA API typically responds in roughly 200 to 500ms for 5,000 candles. Parquet reads (local cache) in roughly 50ms. SQLite preference queries under 5ms.
Thread safety: 133 references to QMutex, threading, or locks. Critical sections (chart data updates,
event bus dispatch) protected. VisPy crashes if Qt widget tree updates during OpenGL context switches. Solved via mutex-wrapped
data buffers and throttled axis updates (see .agent/docs/known_issues/vispy-interval-switching-crash.md). Memory:
roughly 150MB baseline, roughly 300MB with 50,000 candles cached. NumPy arrays dominate (OHLC data, analysis results). CuPy adds
roughly 200MB GPU memory.
Bottlenecks I've eliminated: axis tick calculation (was 5ms, now coalesced + throttled to under 1ms effective), analysis
re-runs on pan (now cached per viewport, invalidated only on data change), Qt stylesheet parsing (precompiled via
QStyleSheet cache). Remaining bottlenecks: OANDA API latency (network-bound, can't optimise further), initial CuPy
import (roughly 500ms first run, amortised over session).
Code Quality: Enforced Standards
Type safety: 2,565 functions with return type hints across 334 files. Mypy runs on every commit. Zero
# type: ignore comments (banned via coding standards). Protocol classes define adapter boundaries. Custom
LoggingManager with profiles (e.g., "charting," "analysis") and keyword filtering. Decorators
(@debug_trace, @timing) inject correlation IDs. Roughly 500 log statements, production build filters
to warnings/errors only.
Value objects: 261 @dataclass definitions. Domain events, commands, queries, view models, all typed. No raw dicts
passed between layers. Event-driven discipline: 254 event bus usages. Events must be immutable dataclasses. Handlers registered
via dependency injection, not scattered imports. Banned patterns include emojis in code/comments (distracting in technical
context), # type: ignore (fix the type issue), TODOs/FIXMEs without tickets (zero found in grep).
What I've Learned
Clean Architecture scales, but costs upfront time. Early prototypes felt slow. Adding a feature meant writing command classes, handlers, events, adapters. Now, adding GPU acceleration or date range mode touches under 10% of files. Worth it.
Qt + OpenGL is finicky. Thread safety between Qt's event loop and OpenGL contexts required deep debugging. Solution: never touch VisPy from Qt signals directly. Queue updates via thread-safe buffers. I documented these issues extensively because official docs lack real-world multi-threading examples.
Python can be fast enough. With NumPy/CuPy, batched rendering, and event coalescing, Python handles real-time charting at 160fps. The trick: push loops to C extensions (NumPy) or GPU (CuPy), keep Python layer thin. Logging profiles matter. Enabling all debug logs slowed the app noticeably (roughly 10% frame time increase). Profiled logging system lets me enable "charting.viewport" logs without flooding console with "analysis.pivots" noise.
Premature abstractions hurt. Initial event bus design used inheritance hierarchies (BaseEvent, ChartEvent, DataEvent). Refactored to flat dataclasses with union types. Simpler, faster, easier to trace.
What's Next
Short-term priorities: Replay mode (step through historical data candle-by-candle for backtesting strategies). Commands/events already exist, need GUI controls and playback speed adjustments. Multi-symbol support (currently single chart per container). Plan: multiple containers with synchronised time axes. Repository layer supports this, GUI needs refactor. Persistent analysis cache (market structure analysis results currently cache in-memory). Move to SQLite for session persistence (analysis cache repository already defined, need serialisation logic).
Performance optimisations: Shader precompilation (GLSL shaders compile on first use, roughly 50ms). Precompile during app startup or ship compiled binaries. Lazy overlay loading (all overlays: FPS counter, cursor tracker, price labels, initialise on chart creation). Defer until user enables them.
Technical debt: Some early UI components (gradient date picker) have complex internal state. Consider refactoring to Redux-style state management for easier testing. OANDA adapter retries on failure but lacks exponential backoff. Add jitter to prevent thundering herd.
Closing Thoughts
I built Valgo in collaboration with a trader who needed better tools for market structure analysis. 500 files and several rewrites later, we have a working answer: yes, Python can handle this, with caveats. Python's ecosystem (NumPy, Qt, OpenGL bindings) handles real-time charting fine. The hard parts weren't language-specific: thread safety, event coalescing, OpenGL state management would be tricky in any stack.
Key takeaway: architecture matters more than language. Clean boundaries let me swap SQLite for Parquet, add GPU acceleration, and refactor UI components without rewriting the charting engine. That flexibility is worth the upfront ceremony.
If you're building something similar, consider: Keep business logic pure (no UI framework imports). Ports and adapters save you later. Profile early. I wasted weeks optimising the wrong bottleneck (axis rendering). Measure first. Document known issues. Qt's stylesheet vs. palette behaviour, VisPy's thread restrictions. Write these down. Future you will thank past you.
The app isn't done (is software ever?), but it's stable, fast, and handles real market data without choking. That's a milestone worth celebrating.
Stats Summary:
- Codebase: 508 Python files, roughly 50,000 lines (estimate)
- Architecture: Clean Architecture, DDD, Event-driven, CQRS
- Services: 83 service/repository/controller classes
- Events: 254 event bus usages, 6 files with coalescing logic
- Dataclasses: 261 typed value objects
- Type hints: 2,565 functions with return type annotations
- Dependencies: PySide6 (208 imports), VisPy (32 imports), CuPy (9 imports)
- Rendering: 48 visual component files, 12 GLSL shaders, 38 overlay/visual/renderer classes
- SQLite: 7 repository implementations, WAL mode
- GPU: Optional CuPy acceleration for analysis (roughly 5x speedup on RTX hardware)
- Performance: 160fps with 10,000 candles, under 1ms effective axis updates (coalesced + throttled)
- Thread safety: 133 mutex/lock references for Qt/OpenGL coordination
Tech Stack:
- Python 3.13.8
- PySide6 (Qt6) for UI
- VisPy (OpenGL) for charting
- SQLite (WAL mode) for persistence
- CuPy (optional) for GPU acceleration
- OANDA API for forex data
Recent Features:
- Event coalescing (eliminates panning lag)
- Date range mode (historical data by date picker)
- GPU-accelerated market structure analysis (BOS, ChoCh, sweeps)
- Axis label hiding during interactions (reduces flicker)
Code Quality:
- Zero
# type: ignorecomments (banned) - Zero TODO/FIXME comments without tickets (none found)
- Mypy + Ruff linting enforced
- Custom logging system with profiles and correlation tracking
- Comprehensive documentation (15+ markdown files in
.agent/)
Performance:
- Rendering: 160fps with 10,000 candlesticks
- Data loading: OANDA API roughly 200 to 500ms, Parquet roughly 50ms, SQLite under 5ms
- Analysis: roughly 30 to 40ms GPU (CuPy), roughly 150ms CPU (NumPy fallback)
- Memory: roughly 150MB baseline, roughly 300MB with 50,000 candles